
Carbon dioxide is demonstrated as the main component of the Carbon Cycle on Earth – a series of processes that transfer carbon in various forms throughout our ecosystem. Volcanic outgassing and wildfires are two major natural sources of CO2 that should be named firstly. Respiration, the process by which organisms get energy from their food, produces carbon dioxide. Human activities, combustion engines or in the industry, all produce CO2. As this would be, CO2 is a very important part of the earth. It is a major greenhouse gas that aids in the trapping of heat in our atmosphere, our world would be inhospitably cold without it. However, when the CO2 concentration grows, it contributes to global warming, thereby threatening to change our planet’s climate as average world temperatures rise. After industrial revolutions, CO2 was thrown into the air, causing serious climate change and human issues.
CO2 concentrations had risen sharply from pre-industrial levels of around 280 parts per million to over 410.5 parts per million by the start of 2019 [1]. Lately, the world was hit by a global pandemic known as coronavirus (COVID-19), which has spread to hundreds of countries worldwide, it spread quickly over the first few months across the world, infecting countries and territories, resulting in about 25 million confirmed cases and nearly 837000 fatalities. As of October 2021, the numbers are 235 million and approximately 4.9 million, respectively (recently updated data can be found in [2]). The entire Coronavirus Pandemic database may be reviewed here [3].
Lockdown orders had become the most important defensive front-line we’d ever had, with facemasks and hand sanitizer as our weaponry. Lockdown cities, school closures, transportation restrictions, industrial closures, company downsizing, and institutions, to name a few examples, have all been imposed by governments to regulate human activity in times of crisis. The spread of the COVID-19 was slowed as a result of these huge measures. At the same time, global climate data had changed dramatically for the first time in recorded history.
According to investigations conducted during the lockdown, CO2 levels have already decreased by nearly a fifth of all time, Fig.1, a huge number not seen since World War II.
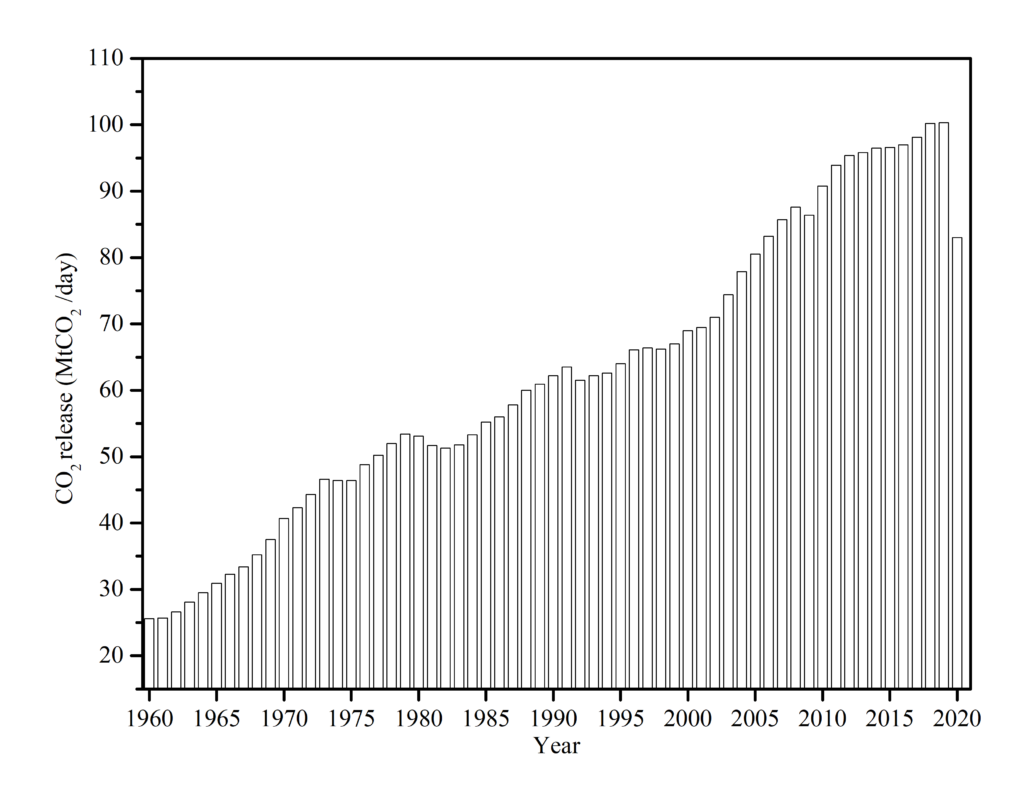
Based on the fact that CO2 levels fell by 17 percent in April 2020 compared to that of 2019, the first prediction anticipated that the CO2 level would fall between 4.2 and 7.5 percent from last year. The amount of CO2 in the atmosphere seems to have dropped as a consequence of enhanced social distance, which has led to the reduction of product consumption and manufacturing activities. Likewise, a decline in transportation operations contributed to the global fall in carbon emissions. Global aircraft traffic decreased by 60% during the closure, resulting in a short drop in CO2 emissions relative to pre-crisis levels. According to CNBC [5], the United States led the way with a reduction of 12 percent in carbon dioxide emissions, followed by the European Union with an 11 percent lower. India experienced a 9 percent decrease, while China saw a 1.7 percent share. Scientists estimate that this cut may have saved at least 77,000 lives.
Simultaneously, analyzing the northern ozone hole reveals the smallest ozone hole ever seen in history, shrinking from 6.3 million square miles annually to less than 3.9 million square miles at the beginning of 2020. Fig.2. Previously, the Montreal Protocol, which limited the manufacture of ozone-depleting chemicals and was approved internationally in 1987, was mainly credited in major part for ozone recovery (Because the use of CFCs has already damaged the ozone layer). During the Crisis, according to NASA experts, ozone concentrations above Arctic parts of the planet dropped by around 240 Dobson Units (The Dobson Unit -DU is a unit of measurement of the amount of a trace gas in a vertical column through the Earth’s atmosphere) on March 12, 2020, compared to March 12, 2019.
The pandemic’s impact appears to have aided the ozone layer’s recovery since the urge to heal has accelerated the process.
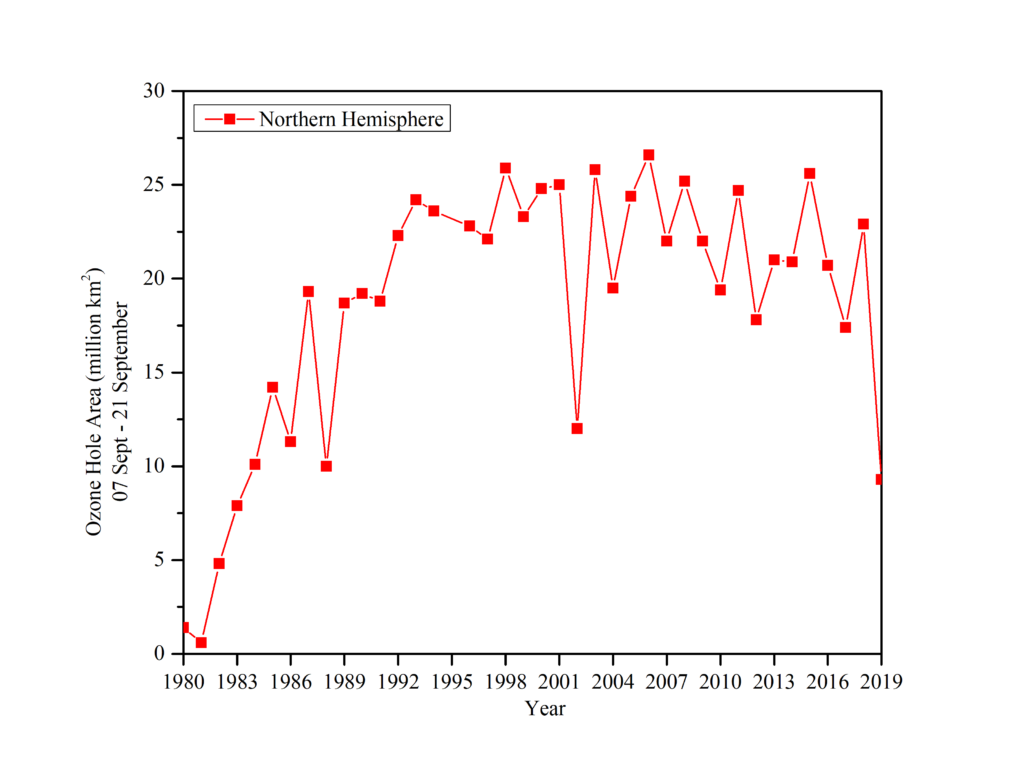
In another development, the ozone hole over Antarctica rapidly expanded starting in mid-August and peaked at around 24.8 million square kilometers in September 2020, covering the whole continent with ozone layer depths as low as 94 DU. As temperatures rise high in the atmosphere in late spring, ozone depletion diminishes, the polar vortex weakens, eventually breaks down, and ozone levels recover to near-zero by the end of December. Since the time that the ozone layer was started monitoring 40 years ago, it was the longest-lasting and one of the biggest and deepest holes [6].
These are all promising information, nevertheless, might be far away from reality because it was projected based on all indications during a shelter-in-place order, and circumstances will alter afterward, particularly when tight limitations have been relaxed. Researchers anticipate that emissions will rebound at the end of 2021 and the beginning of 2022, and they urge governments to include renewable energy and climate policy in their economic recovery strategies.
The fact that CO2 emissions globally decreased by 1.4-1.5 percent during the Financial Crisis in 2009, but followed by a huge increase of over 5% [7] only a year after. The Washington Post [8] also reported that COVID-19 might stabilize the global CO2 emission rate, but we shouldn’t be too relieved as evidence of the financial crisis. There is no surprise that CO2 could be emitted in excess of it after this situation.
Back into 2017, the CO2 emitted 2017 had an average concentration of 404 parts per million and keep reaching higher over the years. In 2019, it reached 410.5 parts per million, up 2.6 parts per million from 2018, and higher than the 10-year average. Although the carbon emissions decreased by 17 percent at their peak due to the lockdowns in late 2019-2020, the total effect on concentrations was extremely minor.
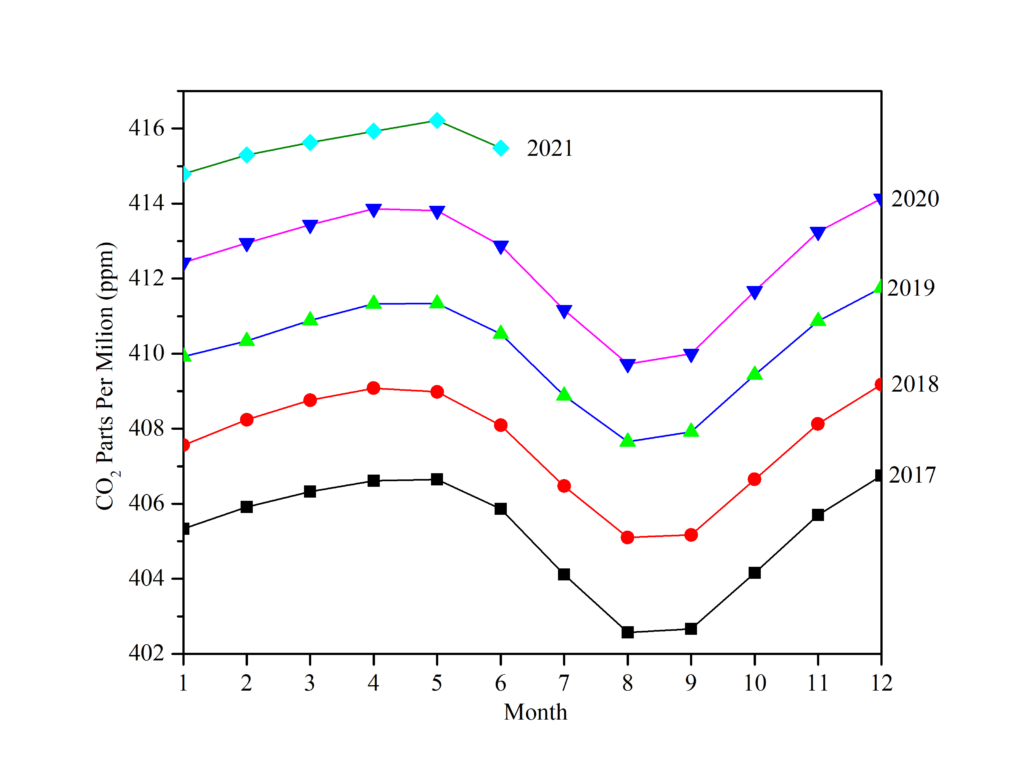
CO2 recorded data keep growing in the second half of the year, following the prior pattern (Fig.3), notwithstanding the earlier effects of the crisis. The CO2 emitted steadily rises, with statistics showing that the average CO2 in August 2021 was 414.47 ppm, whereas it was 412.78 ppm in August 2020, with no signs of slowing down anytime soon.
The situation, as the evaluation of the National Oceanic and Atmospheric Administration, is still complex. CO2 Global emissions fell in 2020, has minimal impact on overall carbon emissions due to seasonal and natural fluctuations. Wildfires burning through forests released carbon dioxide even as emissions fell, potentially at a rate equal to the modest fall in emissions owing to the pandemic’s diminishing effect on the global financial system.
So, did the epidemic demonstrate that we had already begun to cut carbon emissions?
Temporarily, the answer is “Sort of, but not much”. When emissions fall below a certain level, global warming draws to a standstill, and COVID-19 doesn’t appear to have changed much.
This text was written by Minh Nguyen Quang.
References
- Lindsey, R. Climate Change: Atmospheric Carbon Dioxide. Available from: https://www.climate.gov/news-features/understanding-climate/climate-change-atmospheric-carbon-dioxide.
- Seo, H., Recent Scientific Progress on Developing Supported Ni Catalysts for Dry (CO2) Reforming of Methane. Catalysts, 2018. 8(3).
- Covid-19 database. Available from: https://ourworldindata.org/coronavirus.
- Global Monitoring Laboratory – Ed Dlugokencky and Pieter Tans, N.G.g.n.g.c.t. Trends in Atmospheric Carbon Dioxide. Available from: https://gml.noaa.gov/ccgg/trends/gl_data.html.
- CNBC, E.N.-. Covid pandemic drove a record drop in global carbon emissions in 2020. Available from: https://www.cnbc.com/2020/12/11/covid-record-drop-global-carbon-emissions-2020.html.
- Organization, W.M. Record-breaking 2020 ozone hole closes. 2021; Available from: https://public.wmo.int/en/media/news/record-breaking-2020-ozone-hole-closes.
- Peters, G.P., et al., Rapid growth in CO2 emissions after the 2008–2009 global financial crisis. Nature Climate Change, 2012. 2(1): p. 2-4.
- The Washington Post. Available from: https://www.washingtonpost.com/climate-environment/2020/03/06/coronavirus-could-halt-worlds-emissions-growth-not-that-we-should-feel-good-about-that/?arc404=true.