From July 11 to 15 the consortium assembled in the sunny capital of Portugal for another inspiring meeting. The first two days gave the ESRs a thorough introduction to chemical reactor modelling. Also training sessions in CV writing and job interviews were part of the schedule. With the end of the project in sight the latter becomes more and more important of course.
The last two days also the supervisors and the advisors of the project joined for engaged discussion on open scientific questions as well as to tell about their career paths and experiences.
And on Wednesday? Well, in some outdoor team building activity we have shown that we do not only look at the future but also at the past by following the fossilized footsteps of dinosaurs!
Not only have Omar Biondo and his co-workers recently published their work in the Chemical Engineering Journal but it has also been featured in the latest edition of the newsletter of the International Low Temperature Plasma Community.
Energy transition and the use of alternative fuels, such as green hydrogen and green methane, is an important challenge nowadays. These issues are directly linked to the problem of global CO2 emissions. Recent European policy trends have focused on the possibility of utilizing carbon dioxide in chemical processes. The available installations that use CO2 produced as a waste gas are already being demonstrated. Nowadays, the most important challenge is to expand these installations up to larger scales to find economic and sustainable solutions.
One of these possible solutions is chemical reactions in which carbon dioxide can be used as a feedstock, such as methanation, methanolation, CO2 to chemicals, or the reforming of methane using CO2 (DRM). However, most of these processes are catalytic, meaning that they take place at high temperatures or pressures. Thus, the use of non-thermal plasmas in such processes can lead to a reduction in the energy used, making the process easier to carry out. Such reactions can be used for so-called energy storage.
Plasma–catalytic-assisted processes are very complex, both at the level of gas phase (or liquid phase) interactions and at the level of solid–gas phase (liquid phase) interactions. Key to these interactions are the activation processes of CO2 molecules, as well as the reaction centers of the catalyst, which in a traditional reaction are created under high temperatures.
In the pioneering Special Issue, all of these aspects related to the fields of physics, material science, catalysis, chemistry and the chemical engineering of plasma–catalytic processes will be presented.
Prof. Dr. Patrick Da Costa Prof. Dr. Annemie Bogaerts Dr. Vasco Guerra Prof. Dr. Monika Motak Dr. Bogdan Samojeden Guest Editors
From April 11 to 15 the ESRs gathered in Paris for a training in entrepreneurship and communication. But not only the ESRs! This time the training was open for other PhDs as well – an opportunity embraced by PhDs from multiple Pioneer-affiliated institutes. For sure the program benefited from that diverse gathering of people and ideas!
In multiple sessions the ESRs learned to formulate their business idea and how to proceed from their. Hence, also funding, let it be for a business or for research, was important topic of the school. The third pillar of the school was communication. In particular, the pitch, i.e. a very short presentation of one’s idea to convince potential funders, was practiced. The ESRs even got some vocal training! Overall, a very interesting and insightful training!
The Marie Curie Alumni Association (MCAA) brings together members who are currently benefiting or benefitted from an MSCA funding, which means that they have a background in research but with diverse career paths. The MCAA receives funding and support from the European Commission.
The MCAA organized its annual conference in Lisbon, on the 26th and 27th of March. Two of our ESRS, Beatrice and Chloé, participated to this conference onsite and presented a poster (realized in collaboration with Minh, who joined online), to introduce the PIONEER project to the MCAA community, which was received with great interest. The focus of the conference was sustainability and the post-pandemic workplace. Different sessions took place during these two days with a special emphasis on greening research and universities, science policy at the European level, alternative careers (from research to policy advice for instance), mental wellbeing in the research environment, how MCAA supports Ukraine and the impact of COVID on researchers among other topics. The general assembly and the election of the new board members of the MCAA took place as well.
As MSCA fellows it is a great opportunity to join this Alumni Association, not just to take part in science activism but also for fruitful networking opportunities. It was a very interesting as PhD students to get to know about the career of scientists in policy making and science diplomacy, which are not straightforward options when thinking about the path after the doctorate.
Laboratory Efficiency Assessment Framework (LEAF) contains actions which lab users can take to save plastics, water, energy and other resources which will reduce their carbon emissions:
Today, on 8 March, 2022, we celebrate the international women’s day (IWD). It’s official campaign theme this year is #BreakTheBias. It underpins that to obtain a gender equal world without stereotypes and discrimination, everybody’s action is required. This is a fight we should and will face together, because by getting rid of the bias we can see clearly the best ways to improve our society economically, socially and environmentally, as we will try to explain today.
In Pioneer we are dedicated to these goals, so while last year the women in the project had the stage, this year is the guys’ opportunity to express our support and break our biases, indeed, women and men need to self-reflect, unlearn the old ways and relearn based on principles of justice and equality. We, as scientists, understand that knowledge and education is the only way to change paradigms, so together we decided that it was a good opportunity for us, the male ESRs, to educate ourselves in the gender issue in order to bring important information for the community.
For this, we had to take this mission very seriously not to invade women’s space and put too much of our unconscious bias into an article about bias, so the first thing we did was exactly what we would do to start any research: find relevant and reliable data. However, even scientific data (or its interpretation) is not free of some kind of orientation, not only because there is always some of the author (and the reader) in the work, but also because sometimes the problem is so complex that we cannot see it entirely in any simple manner. So while the data is extremely relevant, the interpretation may be taken with a wrong bias.
For example, we all hear about the gender pay gap, meaning the difference between the earnings of women and men. We are used to thinking that this data reflects straightforwardly the difference between the value of the work of different genders but that is not actually true (and this is not necessarily good news). Although this specific statistic is a fantastic way to simplify and show the problem, it is still oriented by, for example, the disproportional presence of women in certain sectors or activities. Let’s take a look at data from Eurostat on the gender pay gap in europe (Figures 1 and 2)
In order to address this problem, they tried to separate the gender pay gap that does not consider any kind of orientation in the data, called unadjusted gender pay gap, into two different data, the explained gender pay gap and the unexplained gender pay gap, meaning the part that is explained by other data like disproportional presence of women in certain areas and the portion that cannot be explained by that.
When we look at the data with that separation, the mean gap in Europe decreases by 3% if one do not consider secondary factors, but this is not the case for some countries, where women preference for certain jobs, for example, public administration, can increase the gap as it pays less in average than private corporations in most countries, except for Romania and Luxembourg, that not coincidentally, have the lower gaps when you look at the unadjusted data, but lose some positions when using the unexplained gender pay gap.
Of course this is one in many other aspects explaining the difference in data, but we can highlight several others that, if we had equal pay to equal work, would end up in women being actually better paid than men in average. First, in most European countries (except Belgium and Switzerland), females have higher levels of education, are in jobs that are better paid (Exceptions to Cyprus, Austria, France and the Netherlands) and generally work in larger companies that also pay better. When we look from this direction, the inequality as a number (11.4% in the unexplained gap), takes larger proportions since we are not only paying less, we are paying less for better educated individuals who are in better jobs, on average.
This whole system of discrimination perpetuates itself in many ways, the first one being precisely the economic one. Since there is this burden for women to succeed economically, and the structures of power are deeply rooted into financial value, they are denied important roles because they cannot compete with men who have easier careers, better paychecks and generally already access places and situations that lead them to positions of power.
The lack of women in those positions, consequently, makes it even harder since they are not included in the decision making and then we do not incorporate gender responsive approaches since it is not in the interest of the ones in power. This has negative effects not only on women of course, it denies society as a whole its full potential, because we are not giving the same opportunities for capable people to change things for the better, based on their gender.
One great example of how this is detrimental for the whole society is climate change. First, the women are more affected by those catastrophes for the simple reason that they are already more vulnerable in society in the first place. This happens because, as we discussed, they have less money but also less rights, less freedom and are misrepresented. When a climate catastrophe like a fire, flood or drought hits, it hits women harder and they are at greater risk of being displaced, injured or killed, and the poverty arising from these issues can stimulate early marriages, prostitution and other abuses that are not a threat for the male population.
Although they are more vulnerable to the effects of climate change, since on average do not reach as many positions of power, they cannot use their perspectives to help on the issue, and this is a very clear effect of gender discrimination, however today we are diving into less obvious reasons and here is another one: when women are treated more equally in their professional lives, they have less children and with less population growth, it can be easier to tackle climate change. Of course this is a discussion of personal fulfillment and societal roles too, but again, if we allow women to succeed in their careers, we are offering them more paths and naturally, more of them will choose to dedicate themselves to the career, as we men can do with relatively fewer burdens.
Again with data from Eurostat, women with children tend to be less employed, and when they do, they are more likely to have part-time jobs. Obviously, choosing not to have a career to take care of kids is definitely a valid option, but the real question is: why doesn’t this negatively affect the employment rates and the choice for part-time jobs for men too? On the contrary, having children actually increases the employment rate for men and decreases the likelihood of them to have part-time jobs in low, medium and high levels of education. The answer may be that, conflicted with harder career paths, lower salaries and overall more barriers to a successful career, some women decide to not engage directly into paid conventional jobs, assuming instead the unpaid and difficult job of taking care of the household.
Figure 3: Employment rate of women and men with or without children by educational attainment level and by working pattern, EU, 2020. Eurostat.
Finally, gender equality and women’s empowerment is extremely important for environmental policies, programmes and projects, leading to better outcomes. Women are responsible for a significant amount of farms, specially in lower-income countries, which can be run more efficiently if they are free from gender discrimination. Still, in some of the same countries women cannot access better equipment or funding, because they are not allowed to own land and thus cannot use it as collateral for loans or even are not allowed to get a loan without a man’s signature.
In conclusion, it is clear that despite the “richness” of the country or the professional area, the equal participation of women and men is necessary. This is the only way to achieve a society that is functioning efficiently and at full capacity, a society where everyone can choose what to do and make a difference on it, a society where Gender-conscious steps are taken to address environmental topics, where women are in positions of power so they can look after other women, a society where in the case of climate catastrophes or wars, certain people are not treated with difference and we can all join our collective experiences to build a world that fits everyone individually and can be better for everyone as a whole.
CoffeeBreakDown is a podcast-style Youtube channel with chats hosted by two budding scientists, Aaron Ho and Luca Vialetto. Their objective is to strengthen connections between the scientific world and the general public, starting with the field of plasma physics. Specifically, they believe that the expression of the more creative and human side of science is a crucial aspect that is often neglected in the community, as opposed to the technical and factual one. In the latest episode Maik Budde from the Pioneer Project and his colleague Tiago Dias joined to discuss fundamentals and application of low temperature plasma.
On 1st of February 2022 the Supervisory Board of the Pioneer Project gathered online to set the course for the final year of the project. Everything was addressed: From the progress of the ESRs, to the planned trainings this year and eventually to the Pioneer Conference on green chemistry in Krakow. We are looking forward for an exciting 2022!
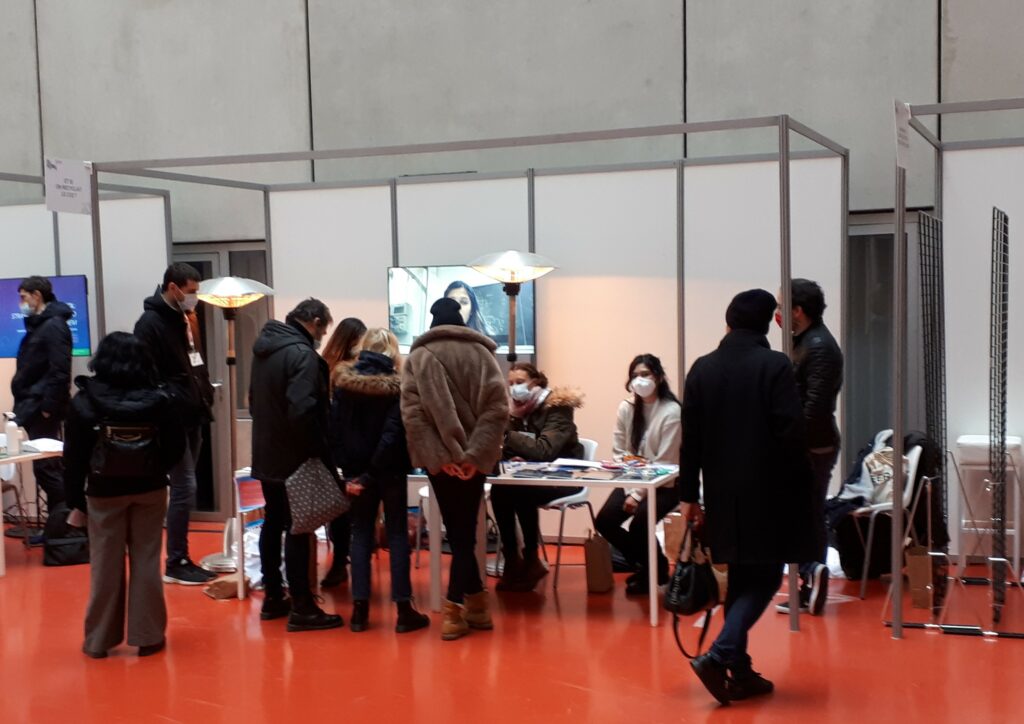
On November 28, 2021 we joined Les Festives, also known as The Sorbonne University Science and Culture Festival, where have been representing the Pioneer project at a dedicated booth showing material and challenging the guest with some quizzes on CO2 conversion, see here if you have not tried yet. Additionally, we organized an open table discussion about the question “What happens if we recycle CO2?”. We enjoyed the interaction with people outside our “science bubble” very much.
Despite the cold we had the chance to share our passion for plasma catalysis with many nice citizens of Paris.


 CoffeeBreakDown is a podcast-style Youtube channel with chats hosted by two budding scientists, Aaron Ho and Luca Vialetto. Their objective is to strengthen connections between the scientific world and the general public, starting with the field of plasma physics. Specifically, they believe that the expression of the more creative and human side of science is a crucial aspect that is often neglected in the community, as opposed to the technical and factual one. In the latest episode